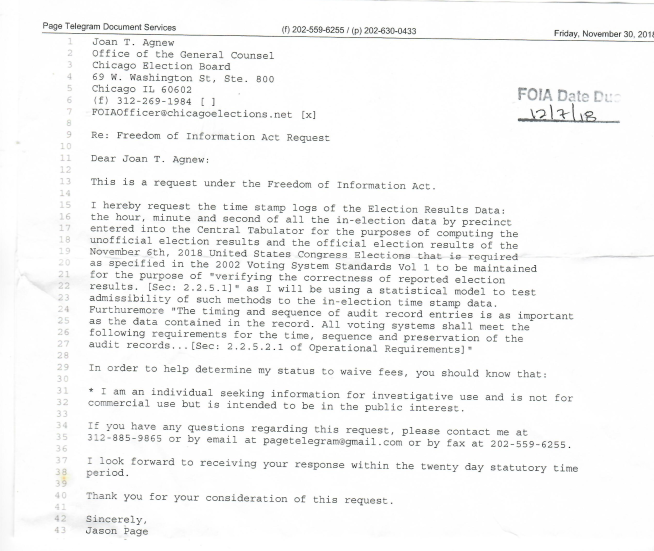
The FOIA Request Submitted with the Responding Data
Attached is the raw data for the November 6th 2018 Election in Chicago. Here is the prior statement from the 2nd study that comparatively exhibit the 2018 data study results.
Study 002: Election Time Stamps of 10,000 sample points per pool compared in sequence to election ballot votes for variance in Benford Curves.
In requesting the data, we quote the 2002 Voting Standards Manual the following way:
I hereby request the time stamp logs of the machine In-Election Log Data: the hour, minute and second of all the in election data from the 1st Ward to the 50th Ward, the electronic ballot machines as well as the optical ballot scanners on the official election results of the [Election Date and Title] data which is required to be made available for public inspection as specified in the 2002 Voting System Standards Vol 1 to be maintained for the purpose of "verifying the correctness of reported election results. [Sec: 2.2.5.1]" as we will be using a digital forensics model to test admissibility of such methods to the in-election time stamp data. Furthermore "The timing and sequence of audit record entries is as important as the data contained in the record. All voting systems shall meet the following requirements for the time, sequence and preservation of the audit records...[Sec: 2.2.5.2.1 of Operational Requirements]"
In Study001 we sought to investigate whether there is more or irrelevant emergence of the Benford curve in the time-stamps of the ballot scanner and ballot machine logs of the 2019 Mayoral Election, comparing any deviation from that curve by ward and precinct. With initial testing of the 2018 "ballot stops" of the general election with the central tabulator we did see a heavy inclination to the Benford distribution. However since that data is sent in chunks from the ballot machines, we would not expect to see a full Benford distribution. An even distribution would suggest randomness.
The results of Study001 did demonstrate a Benford Curve in approximation, more accurately from maintenance logs to actual central tabulator data.
Study002 intends to use the conclusion of Study001 that the Benford Curve does emerge in Election Times Stamps to observe any deviation of the Benford Curves in segments of 10,000 data points sequentially to the sequential times of actual ballot casts, to ascertain if whether there is a prevalence of artificial ballot casts as the election day comes to a close.
Study source, released through Dominion by Chicago Board of Elections Commission in December of 2019.
From that we extracted from the PDF and extraction done with the ~75mb text data file containing all the machine logs of the 50 wards. We are working on comparing the get the logs per ward as the data set provides only the precincts.
Preliminary Study Results:
Throughout the election day the distribution goes from Benford to Random and back to Benford again. We need much larger data pool to confirm, for example FOIA national level of all machine logs in the United States of the 2016 Nov 8th Presidential Election, that fraud is indeed going on. At least 10,000 data points per pool is needed to confirm Benford method.
The FOIA Request Submitted with the Responding Data